
Topics and markets Q1/2025
Keeping a cool head is key
![[Translate to English:] Dr._Goetz_Albert](/fileadmin/_processed_/9/e/csm_Dr._Goetz_Albert_1_b75c5b90f5.jpg)
European capital markets are currently being shaped by a number of fundamental issues, the impact of which could not be more diverse. On the one hand, there are growing concerns about international trade, which is under pressure due to the tariff announcements by U.S. President Trump. On the other hand, massive fiscal spending programs across Europe are providing significant growth stimulus to the European economy.
Given the unpredictable and at times erratic nature of U.S. policy – where it remains unclear whether it reflects a lasting structural shift or merely a temporary bargaining tactic – investors would be well advised to keep a cool head. Instead, the focus should be on the facts and fundamentals – and these paint a fairlypromising picture for Europe.
Yours
Dr. Götz Albert, CFA
Partner and Chief Investment Officer
Even in times of geopolitical turmoil, there are winners
The signs in Europe point to change. While the much-discussed “Zeitenwende” (“turn of an era”) has introduced a great deal of uncertainty, a closer look reveals substantial opportunities for European companies. While speculation continues about the persistence and impact of U.S. tariffs, European policymakers – led by Germany – have already set the stage by launching massive investment programs for infrastructure and defense.
In Germany alone, estimates point to additional public spending of more than one trillion euros over the next ten years. This is in addition to the EU’s proposed €800 billion in joint defense spending and billions more through the NextGenerationEU fund. The newly announced fiscal initiatives focused on infrastructure and defense could act as a long-awaited catalyst for European economic growth. Current estimates suggest that potential growth could rise by 0.8 percentage points across Europe – and by as much as 1.5 percentage points in Germany.
Those who think only of the obvious beneficiaries – such as construction or defense firms – may be missing the broader picture: these industries rely on a wide range of suppliers and specialized service providers, who also stand to benefit from rising order volumes. The value chain is long, ranging from industrial producers of intermediate goods to manufacturers of technical components, and from infrastructure developers to planning and engineering consultancies. In this environment, European small- and mid-cap companies are ideally positioned.
At the same time, the elevated budget deficits are hitting economic sectors that are characterized by a limited (labor) supply. While this may pose macroeconomic challenges, it offers companies an ideal opportunity to increase margins and boost profits. Market reactions and capital flows in the first quarter have already sent a clear signal. And given the significant undervaluation of European small and mid caps, the upside potential for such niche players remains substantial.
Beneficiaries of German fiscal programs on infrastructure & defense
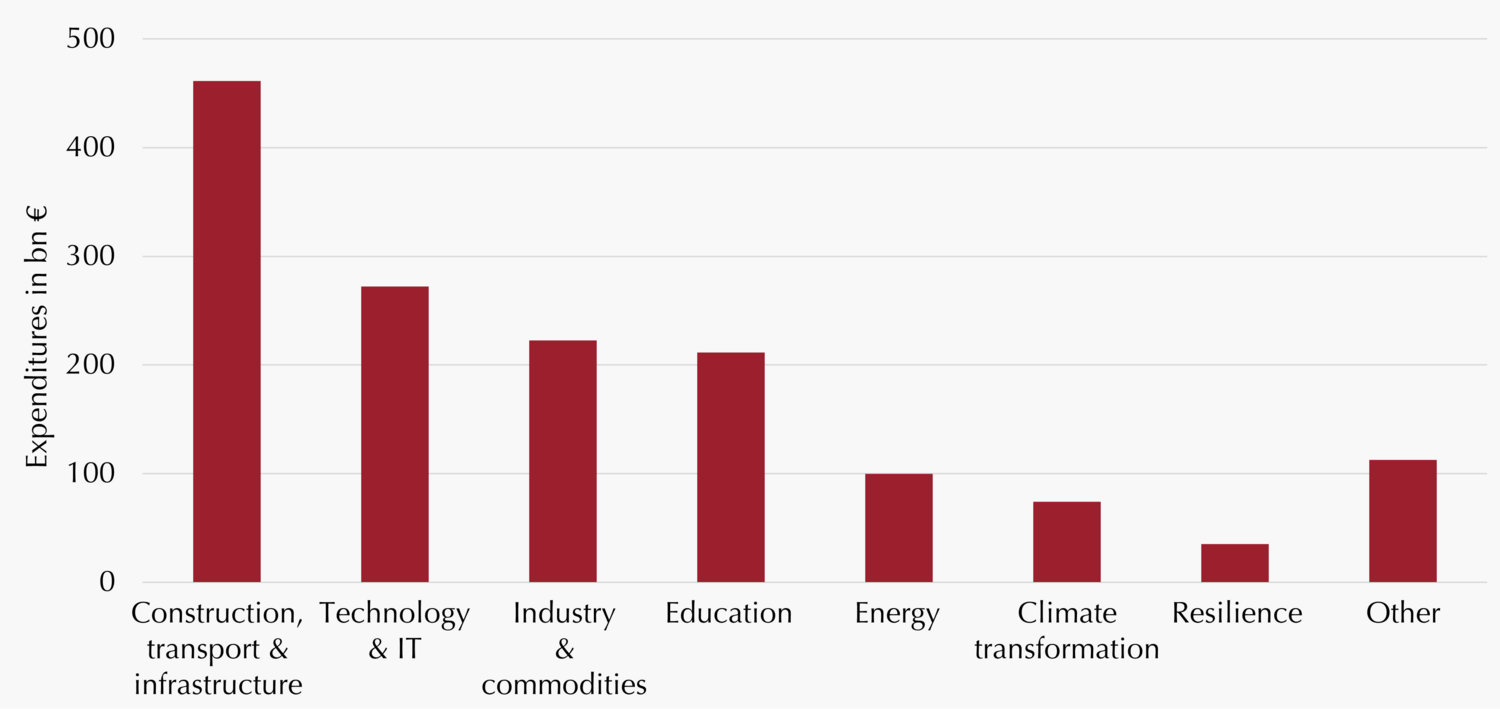
Source: EY, Federation of German Industries (BDI), Commerzbank Research, Lupus alpha. Own calculations and illustration. As of: March 2025.

Dr. Götz Albert
CFA, Managing Partner, CIO

Björn Glück
CFA, Partner, Portfolio Management Small & Mid Caps Europe
Checking out too early can come at a cost
Convertible bonds had a remarkably strong start to the year last quarter. Initially, they outperformed amid rising equity markets, and later successfully withstood the cooling of global equity markets in March.
Looking at the stock market participation rate of convertibles over time, it becomes clear that it is not constant. There are both bull and bear phases in equity markets during which the performance of convertible bonds diverges significantly from those of equities. At other times, however, these hybrid instruments broadly track the direction of equity markets. This variation is largely due to the multiple factors that influence the value of a convertible bond. In addition to the price of the underlying equity (delta), movements in interest rates (rho) and volatility (vega) also play a key role.
Regardless of the current market environment, historical data reveal an interesting pattern: Rather than focusing on short-term one-year periods, an analysis of rolling three-, five- or longer-term investment horizons demonstrates the convex return profile of convertible bonds. Participation in rising markets tends to exceed 50%, while participation in declining markets is typically less than a third.
While equities also benefit from longer holding periods to reduce downside risk, the effect is far less pronounced in this asset class. Equities can remain "under water" for years, whereas convertible bonds tend to reach break-even much faster – primarily due to lower initial drawdowns.
Our analysis of rolling investment periods shows that in approximately 90% of all three-year periods in which equity markets delivered negative returns, convertibles had a participation rate of less than 40%. In 15% of those cases, convertibles even avoided losses altogether (see chart). To fully benefit from this structural pattern, investors in convertible bonds should adopt a holding period of at least three to five years. This helps to smooth the impact of potentially unfavorable entry points.
Distribution of convertible bonds‘ capture ratio of stock market returns (3 years rolling)
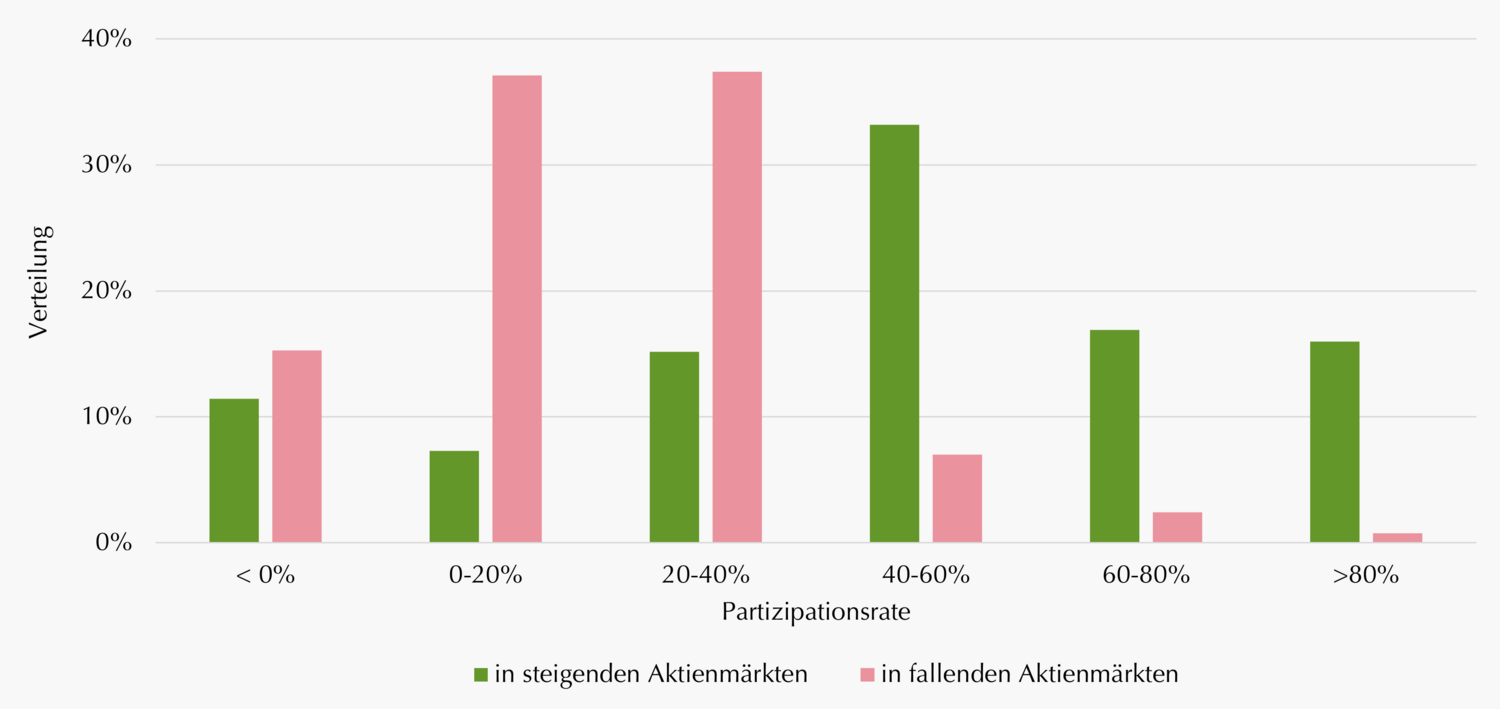
Capture ratio based on participation of Refinitiv Global Focus Hedged Convertible Bond Index (EUR) on the development of MSCI World 100% Hedged to EUR. Period under review: 2002-2025. Source: Bloomberg, Lupus alpha. As of: March 31st 2025. Past performance is not a reliable indicator for the future performance.

Marc-Alexander Knieß
Portfolio Management Global Convertible Bonds

Stefan Schauer
Portfolio Management Global Convertible Bonds

Manuel Zell
CESGA, Portfolio Management Global Convertible Bonds
Expertise is the key to exceptional returns
When talking about CLOs, discussions typically focus on their higher credit spreads and the so-called “waterfall structure”, in which cash flows are first allocated to the more senior tranches before any other tranches receive funds. Far less attention is paid to the “most junior” tranche – the CLO equity. In contrast to the higher rated debt tranches, this equity portion comes at higher risk but also significantly higher return potential.
However, attributing these elevated returns solely to the increased risk does not tell the whole story. CLO managers (who are typically majority owners of the equity tranche) have significant flexibility in managing both the asset pool and the CLO structure itself. This allows them to actively optimize the residual cash flow, i.e. the income from the loan portfolio that remains available for distribution after all debt tranche payments have been made.
For example, during the reinvestment period, CLO managers can take advantage of actively managing the loan portfolio in a fairly inefficient market segment. By purchasing loans below par (a strategy known as “par build”), they can significantly enhance equity returns due to leverage of the structure – CLO equity typically represents only about 10% of the capital stack. If a manager buys loans at 98 cents on the dollar in a stressed market environment, the subsequent recovery to par (which at first sight may look small) can result in equity returns exceeding 20%.
In addition to loan portfolio management, there is also an opportunity to take advantage of narrowing credit spreads. After the non-call period, equity holders may initiate a refinancing of the debt tranches to benefit from improved funding costs which further enhances returns via active liability management.
With the right expertise, CLO managers can respond dynamically to changes in the macro environment and optimize the so-called “CLO arbitrage”, potentially generating significant alpha. As a result, manager selection is critical for investors and fund providers seeking to capture the full return potential of CLO equity.
Additional returns through active management of the collateral pool
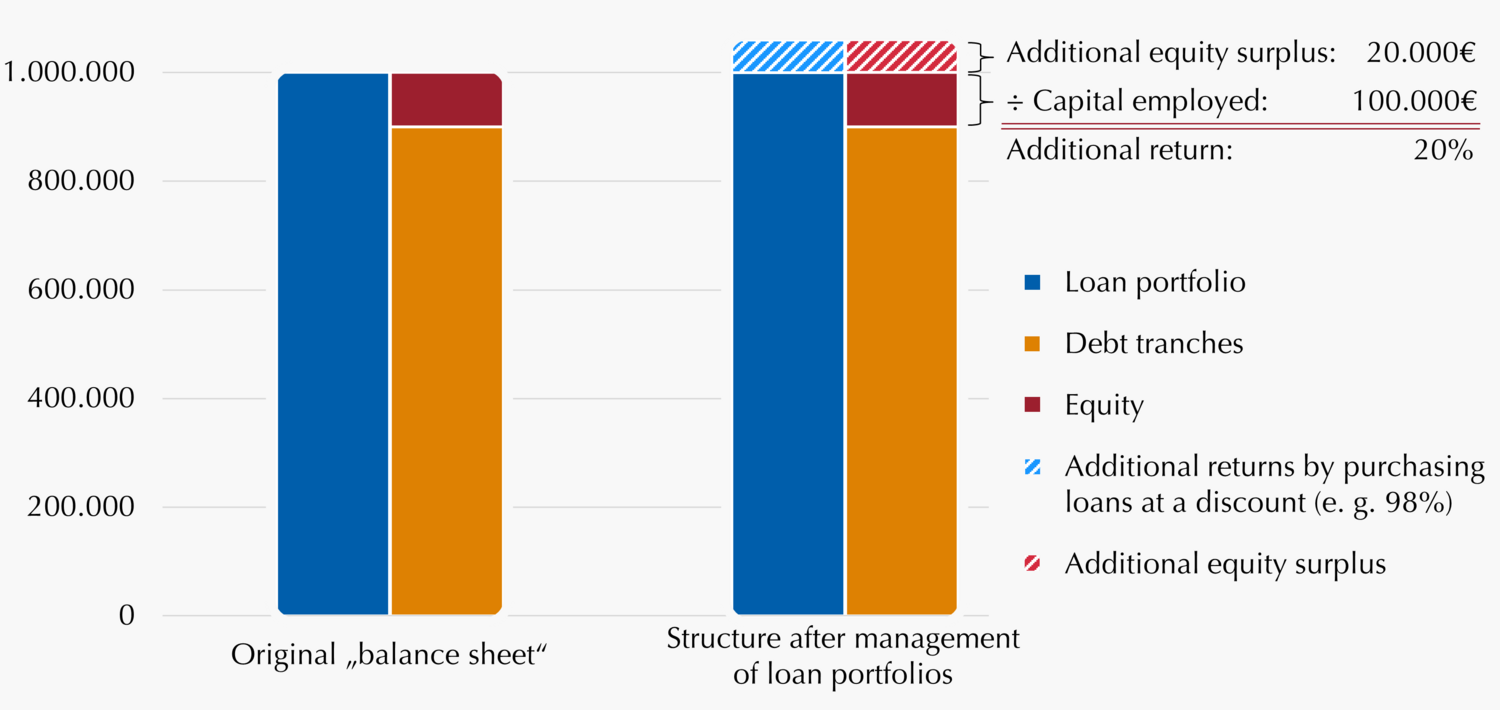
Illustrative figure. Source: Lupus alpha.

Norbert Adam
Portfolio Management Fixed Income Credit

Dr. Klaus Ripper
Portfolio Management Fixed Income Credit
Watch out! Equity risk in volatility shell
Many investors are looking beyond equities and bonds to achieve greater diversification of their portfolios. Increasingly, they are considering short volatility strategies that capture a risk premium which is largely uncorrelated to traditional asset classes’ returns. However, caution is advised: these strategies can contain hidden equity market risks.
Many short volatility strategies rely on selling put options on indices such as the S&P 500 or the EURO STOXX 50. Without proper management, this short put positioning creates a hidden long position in the equity market. While this can be beneficial in rising markets, it can also lead to significant losses in downturns. As a result, the intended diversification may be at least partially undermined.
For maximum diversification, it is crucial to implement a market-neutral approach. This involves consistently neutralizing the market delta created by the option sales, e.g. by using futures. Only through such delta hedging can the volatility risk premium be captured in its pure form, i.e. unaffected by movements in the equity markets. The key factor then becomes the difference between implied and realized volatility. Failure to take this into account can result in an unwanted equity component leading to losses on a total portfolio basis, even if the volatility risk premium itself is positive.
The differences in implementation are not only evident in times of crises. Even a moderate decline in the U.S. equity market in the first quarter highlights these discrepancies (see chart). For investors, it is therefore essential to focus not only on past returns when selecting a volatility strategy but also on the true drivers of returns and the associated risk management. Only a well-structured strategy that solely targets the volatility risk premium can offer real diversification benefits.
Only the collection of the pure volatility risk premium leads to diversification benefits
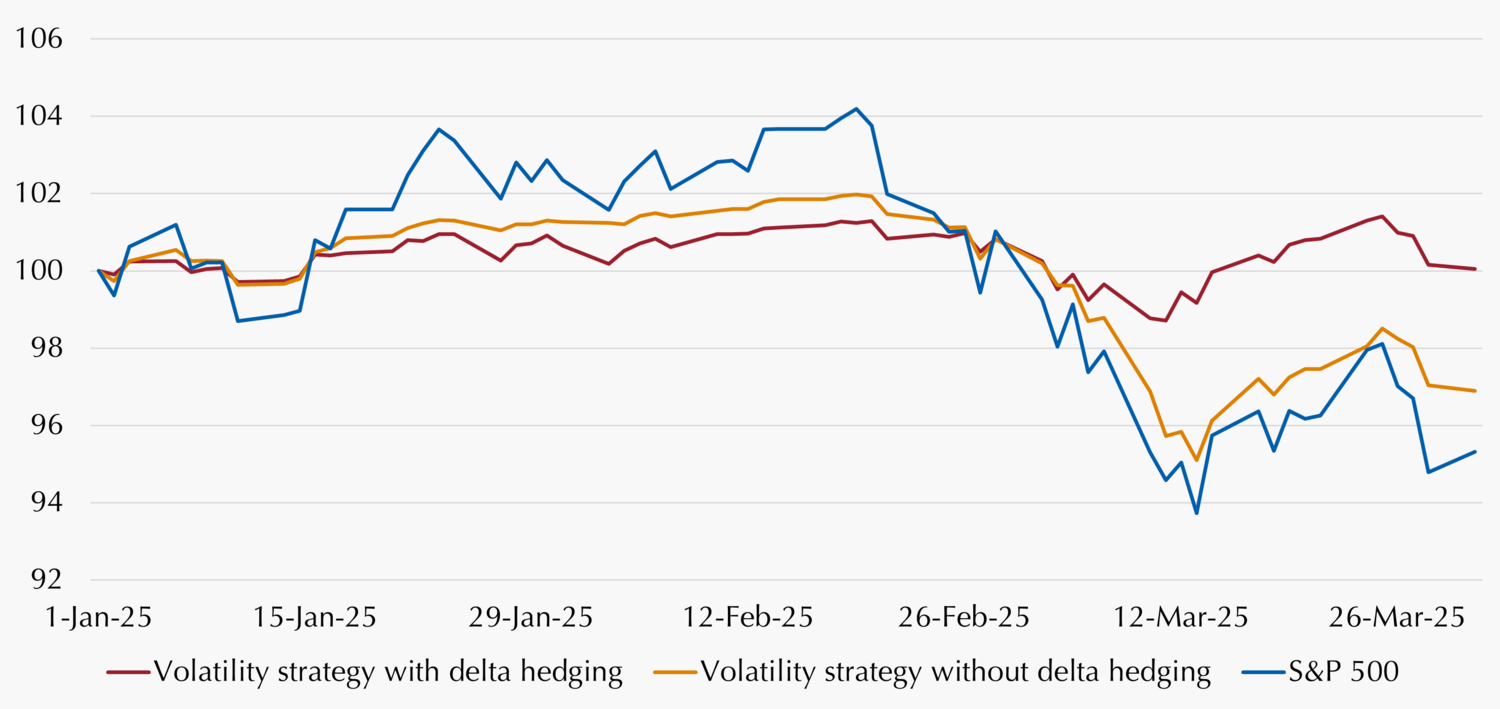
Illustrative figure. Lupus alpha volatility strategy (with delta hedging) vs. various short-volatility strategies without delta hedging. Source: Bloomberg, Lupus alpha. As of: March 31st 2025. Past performance is not a reliable indicator for the future performance.

Mark Ritter
CFA, CAIA, Portfolio Management Derivative Solutions

Alexander Raviol
Partner, CIO Derivative Solutions
Performance divergence reloaded
In recent years, market-cap-weighted U.S. indices have been the main drivers of equity market returns. In particular, the performance of the “Magnificent 7” led to double-digit annual returns and an astonishing U.S. outperformance of other regions. Equally weighted U.S. indices underperformed as well. Now, the tide seems to be turning – the performance charts for the first quarter of 2025 show a mirror image of the past few years: Shares of the U.S. high-flyers have suffered losses of around -16% year-to-date (note: prior to the tariff escalation). This was accompanied by a rotation into European equities (which delivered +6% as of March 31).
However, this effect was not limited to regional divergences. Within the U.S. itself, performance was also reversed: the S&P 500 lost significantly more in the first quarter than the S&P Equal Weight Index (-4% vs. -1%). This difference was driven by losses from former top performers, such as Tesla (-36%), Apple (-11%), Google (-18%) and even Nvidia (-19%).
Options-based value protection strategies have once again benefited from those divergences in the equity market performances, although this divergence was in the opposite direction than in the last quarter: The losses in U.S. stocks and the simultaneous gains in Europe led to relatively lower volatility at the aggregate level, while volatility increased in absolute terms due to the uncertainty surrounding the new U.S. tariff policy. This divergence effect, resulting in lower options premiums, provided opportunities for options-based strategies, as outlined in our last quarterly edition (see Q4/2024 report).
Coincidentally, the single stock example from our last report (Broadcom vs. Intel) also reversed in the first quarter of this year. While Broadcom lost almost -30%, Intel gained about +13%. Accordingly, options-based strategies with a long call profile were well positioned, as the delta of the calls decreased with the higher stock losses (Broadcom) and increased with the rising stock gains (Intel).
These developments once again underscore the added value of options-based protection strategies with convex payout profiles. They provide risk-aware investors with an appropriate investment solution for any market phase.
Illustration of divergence & convexity based on a two-stock example
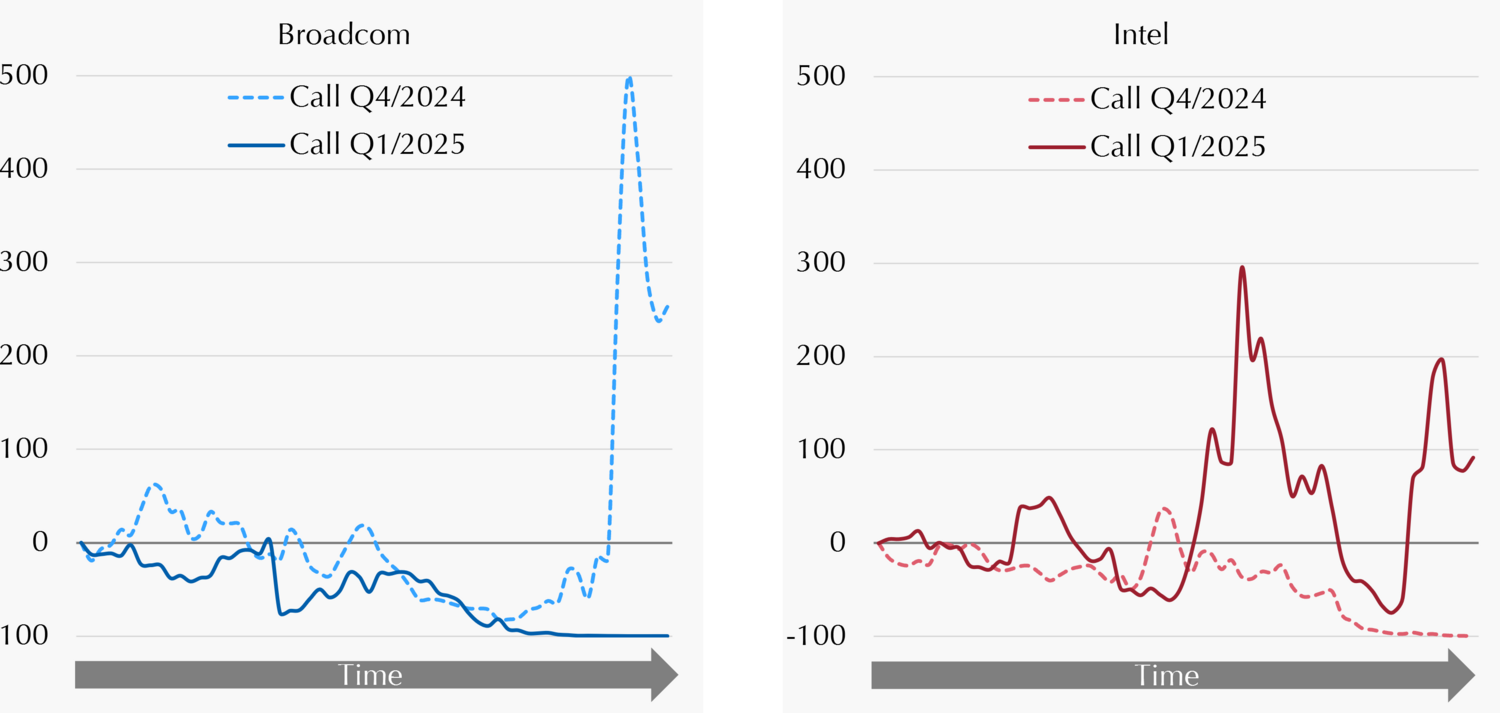
Illustration of ATM calls for Broadcom and Intel in Q4/2024 and Q1/2025, respectively. The figure is displaye for illustrative purposes only and does not constitute any investment recommendation. Source: Bloomberg, Lupus alpha. As of: March 31st 2025. Past performance is not a reliable indicator for the future performance.

Stephan Steiger
CFA, CAIA, Portfolio Management Derivative Solutions
Alexander Raviol
Partner, CIO Derivative Solutions
Hedging continuously – don’t time the market
Many investors use the calendar year as a reference period for strategic asset allocation planning and performance measurement. Likewise, hedging strategies are often conceived and implemented at the beginning of the year – frequently with a focus on mitigating losses by the (fiscal) year-end. However, just as with capital investments that are not diversified over time, a single-point hedging implementation is also highly dependent on timing.
The chart below illustrates this using different implementation frequencies for an exemplary hedging strategy. If an overlay is implemented only once a year, outcomes vary significantly depending on the specific point in time. Whether that timing turns out to be favorable or unfavorable cannot be predicted in advance – it is essentially a matter of chance. As a result, annualized performance contributions from the protection strategy range from highly positive to highly negative (red line), depending on the week of the year in which the hedge was initiated.
In contrast, hedges implemented more frequently and at shorter intervals show smaller fluctuations in performance contributions. As expected, the relevance of timing diminishes. In the ideal case of daily implementation, the starting point becomes entirely irrelevant (blue dashed line).
Investors seeking a more robust, less arbitrary approach to hedging require smarter, more predictable solutions. A continuously implemented hedge can efficiently protect a portfolio over any desired investment horizon – regardless of the specific start date.
Such strategies, for example via option replication, require deep expertise on the part of the overlay manager. Only a specialist in customized risk mitigation solutions can provide this level of know-how – enabling continuous, yet cost-efficient risk management.
Implementation frequency affects performance contribution of protection strategies
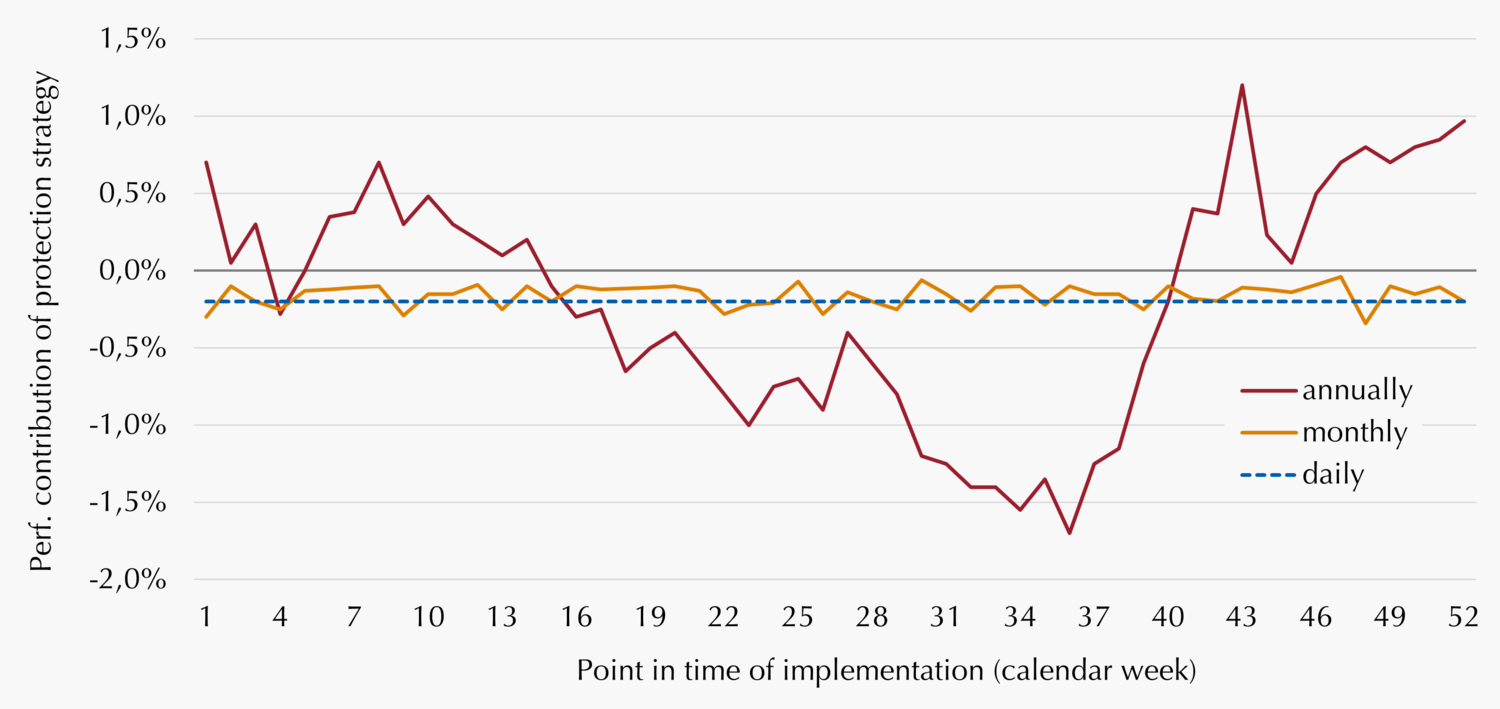
Illustrative figure of protections strategies‘ annualized returns/costs for different implementation frequencies. Source: Lupus alpha.

Marvin Labod
Head of Quantitative Analysis
Alexander Raviol
Partner, CIO Derivative Solutions